
GTA Housing Market: House Prices by Home Type (October 2026)
What homes across the GTA sold for in October 2026, by type of home and city by city, with monthly charts since 2021. Updated monthly.
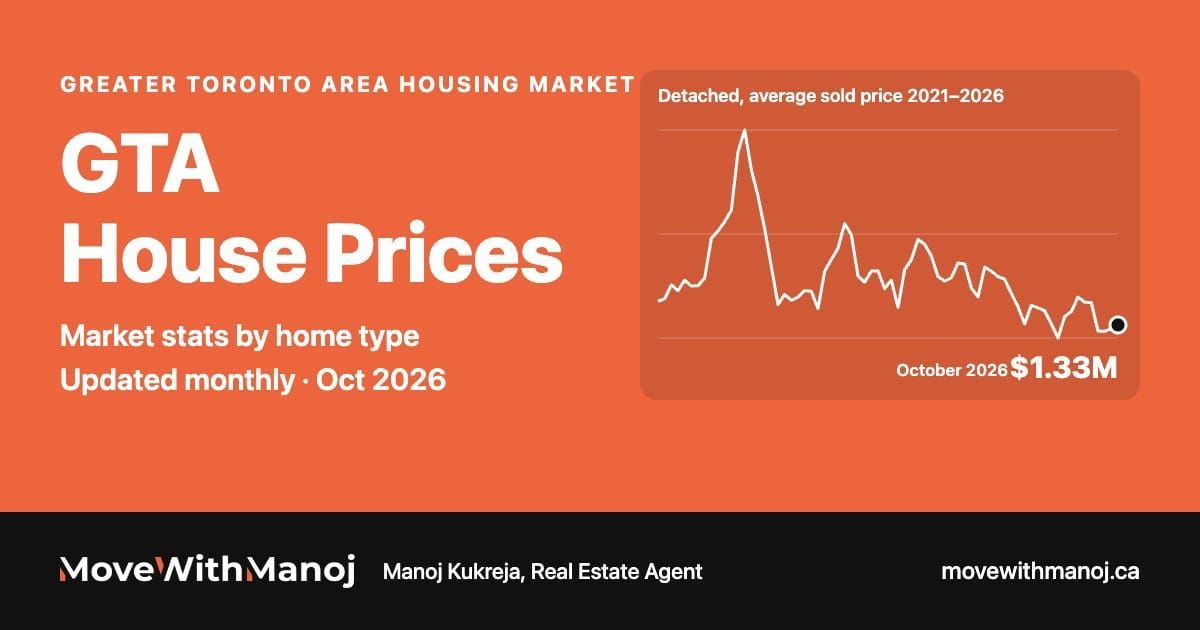
Thinking about buying or selling in the GTA? Here's what homes actually sold for in October 2026, broken down by type of home, plus how prices have moved every month since 2021. I update this page every month, so bookmark it and check back. Looking for one city? Pick it below.
Last updated: November 2026 (October 2026 sales)
GTA house prices at a glance
The average sold price for each type of home in the GTA in October 2026. Tap a card to jump to its chart.
GTA house prices by city
The average sold price in October 2026 for each type of home, city by city. Tap a column to sort it, or tap a city for its full page with charts. A dash means too few homes of that type sold there to give a reliable average.
| City | Detached | Semi | Freehold town | Condo town | Condo apt |
|---|---|---|---|---|---|
| King Township | $2.3M20 sold | – | $1.27M2 sold | – | $490K6 sold |
| Oakville | $1.83M106 sold | $887K5 sold | $978K33 sold | $708K11 sold | $677K34 sold |
| Toronto | $1.6M741 sold | $1.23M266 sold | $1.24M80 sold | $743K137 sold | $659K949 sold |
| Vaughan | $1.55M147 sold | $1.01M18 sold | $987K34 sold | $726K6 sold | $539K57 sold |
| Markham | $1.52M111 sold | $977K20 sold | $1.01M46 sold | $789K17 sold | $590K59 sold |
| Richmond Hill | $1.52M105 sold | $1.36M4 sold | $1.01M30 sold | $649K12 sold | $496K33 sold |
| Aurora | $1.4M32 sold | $950K3 sold | $956K5 sold | $639K8 sold | $567K2 sold |
| Stouffville | $1.38M32 sold | $862K3 sold | $793K11 sold | $575K2 sold | $803K3 sold |
| Burlington | $1.38M101 sold | $869K10 sold | $857K21 sold | $759K42 sold | $659K37 sold |
| Mississauga | $1.33M200 sold | $909K67 sold | $883K17 sold | $677K94 sold | $505K128 sold |
| East Gwillimbury | $1.3M24 sold | $936K2 sold | $797K5 sold | – | – |
| Caledon | $1.24M55 sold | $883K5 sold | $825K11 sold | $608K2 sold | – |
| Milton | $1.22M61 sold | $891K8 sold | $799K38 sold | $593K10 sold | $526K11 sold |
| Halton Hills | $1.18M44 sold | $720K2 sold | $791K7 sold | $588K5 sold | $570K1 sold |
| Uxbridge | $1.13M8 sold | – | $700K1 sold | – | $560K1 sold |
| Newmarket | $1.11M60 sold | $751K15 sold | $802K13 sold | $644K7 sold | $433K3 sold |
| Pickering | $1M46 sold | $657K2 sold | $749K23 sold | $570K14 sold | $472K8 sold |
| Ajax | $994K59 sold | $711K2 sold | $682K5 sold | $554K3 sold | $528K4 sold |
| Whitby | $985K69 sold | $716K2 sold | $724K19 sold | $588K6 sold | $493K6 sold |
| Scugog | $977K27 sold | – | – | – | – |
| Brampton | $941K249 sold | $754K81 sold | $722K53 sold | $567K26 sold | $368K23 sold |
| Georgina | $820K65 sold | $699K4 sold | $766K2 sold | – | – |
| Clarington | $817K77 sold | $593K3 sold | $651K16 sold | $479K5 sold | $439K8 sold |
| Oshawa | $705K108 sold | $590K14 sold | $596K11 sold | $450K13 sold | $414K6 sold |
| Brock | $697K13 sold | – | – | – | – |
| All of the GTA | $1.33M2560 sold | $1.03M536 sold | $916K483 sold | $685K421 sold | $622K1380 sold |
Sorted by detached price, highest first. Source: TRREB Market Watch, October 2026.
Detached houses in the GTA
Average sold price, October 2026
Detached houses in the GTA sold for about 3% less than a year ago. 2560 sold in October, down from 2700 a year earlier.
 movewithmanoj.ca
GTA detached houses: average sold price
Every month since January 2021. Point at (or tap) the line to see any month.
Embed this chart on your website
Free to use. Copy this code into your website or blog and keep the credit link.
What detached houses sold for before
*How much higher (▲) or lower (▼) the October 2026 price is compared with then.
Own a detached house in the GTA? Find out what it's worth today.Free home evaluation based on recent GTA sales. No pressure, no obligation.Get my free home evaluation →Semi-detached houses in the GTA
Average sold price, October 2026
Semi-detached houses in the GTA sold for about 1% less than a year ago. 536 sold in October, down from 580 a year earlier.
movewithmanoj.caGTA semi-detached houses: average sold price
Every month since January 2021. Point at (or tap) the line to see any month.
Embed this chart on your website
Free to use. Copy this code into your website or blog and keep the credit link.
What semi-detached houses sold for before
*How much higher (▲) or lower (▼) the October 2026 price is compared with then.
Own a semi-detached house in the GTA? Find out what it's worth today.Free home evaluation based on recent GTA sales. No pressure, no obligation.Get my free home evaluation →Freehold townhouses in the GTA
Average sold price, October 2026
Freehold townhouses in the GTA sold for about 3% less than a year ago. 483 sold in October, down from 552 a year earlier.
movewithmanoj.caGTA freehold townhouses: average sold price
Every month since January 2021. Point at (or tap) the line to see any month.
Embed this chart on your website
Free to use. Copy this code into your website or blog and keep the credit link.
What freehold townhouses sold for before
*How much higher (▲) or lower (▼) the October 2026 price is compared with then.
Own a freehold townhouse in the GTA? Find out what it's worth today.Free home evaluation based on recent GTA sales. No pressure, no obligation.Get my free home evaluation →Condo townhouses in the GTA
Average sold price, October 2026
Condo townhouses in the GTA sold for about 7% less than a year ago. 421 sold in October, down from 454 a year earlier.
movewithmanoj.caGTA condo townhouses: average sold price
Every month since January 2021. Point at (or tap) the line to see any month.
Embed this chart on your website
Free to use. Copy this code into your website or blog and keep the credit link.
What condo townhouses sold for before
*How much higher (▲) or lower (▼) the October 2026 price is compared with then.
Own a condo townhouse in the GTA? Find out what it's worth today.Free home evaluation based on recent GTA sales. No pressure, no obligation.Get my free home evaluation →Condo apartments in the GTA
Average sold price, October 2026
Condo prices change with the mix of units that sell each month, so the trend line tells you more than any single month. The average is about 6% lower than a year ago.
movewithmanoj.caGTA condo apartments: average sold price
Every month since January 2021. Point at (or tap) the line to see any month.
Embed this chart on your website
Free to use. Copy this code into your website or blog and keep the credit link.
What condo apartments sold for before
*How much higher (▲) or lower (▼) the October 2026 price is compared with then.
Own a condo in the GTA? Find out what it's worth today.Free home evaluation based on recent GTA sales. No pressure, no obligation.Get my free home evaluation →Average rent in the GTA
Thinking about renting, or buying a place to rent out? Here's what GTA condos and condo townhouses leased for, on average, from July to September 2026.
Rents come from TRREB's quarterly rental report and are updated every three months. These GTA figures combine every GTA city in the report. Each city's page shows its own rents.
What this means for you
If you're buying: there's a fair amount of choice and most homes aren't selling overnight, so you have time to compare and some room to negotiate.
If you're selling: pricing right from day one matters more than ever. Homes that are priced well still sell, while overpriced ones sit. The first step is knowing what your home is worth today.
What's your GTA home worth?
Get a free home evaluation based on what's actually selling on your street. No pressure, no obligation.
Get my free home evaluationOr call me at 647-576-2100.
Frequently asked questions
What is the average house price in the GTA?
It depends on the type of home. In October 2026, the average sold price in the GTA was $1,333,841 for a detached house, $1,031,400 for a semi-detached house, $916,170 for a freehold townhouse, $684,715 for a condo townhouse and $621,895 for a condo apartment.
Are house prices going down in the GTA?
Compared with October 2025, detached houses were down about 3%, semi-detached houses were down about 1%, freehold townhouses were down about 3%, condo townhouses were down about 7% and condo apartments were down about 6%. The average detached price is about 27% below its peak of $1.83M in February 2022.
What is the average rent in the GTA?
From July to September 2026, the average monthly rent in the GTA was $2,341 for a 1-bedroom condo, $3,070 for a 2-bedroom condo, $2,830 for a 2-bedroom condo townhouse and $3,213 for a 3-bedroom condo townhouse.
Where do these numbers come from?
Average sold prices and the number of homes sold come from the Toronto Regional Real Estate Board's monthly Market Watch report. Days to sell, homes for sale and the share of asking price come from GTA listings on movewithmanoj.ca. This page is updated every month.
More about the GTA: pick your city in the list at the top of this page for its own prices, charts and rents.