
Burlington House Prices: Market Stats by Home Type (October 2026)
What homes in Burlington sold for in October 2026, by type of home, with simple charts of every month since 2021. Updated monthly.
Thinking about buying or selling in Burlington? Here's what homes actually sold for in October 2026, broken down by type of home, plus how prices have moved every month since 2021. I update this page every month, so bookmark it and check back.
Last updated: November 2026 (October 2026 sales)
Burlington house prices at a glance
The average sold price for each type of home in Burlington in October 2026. Tap a card to jump to its chart.
Detached houses in Burlington
Average sold price, October 2026
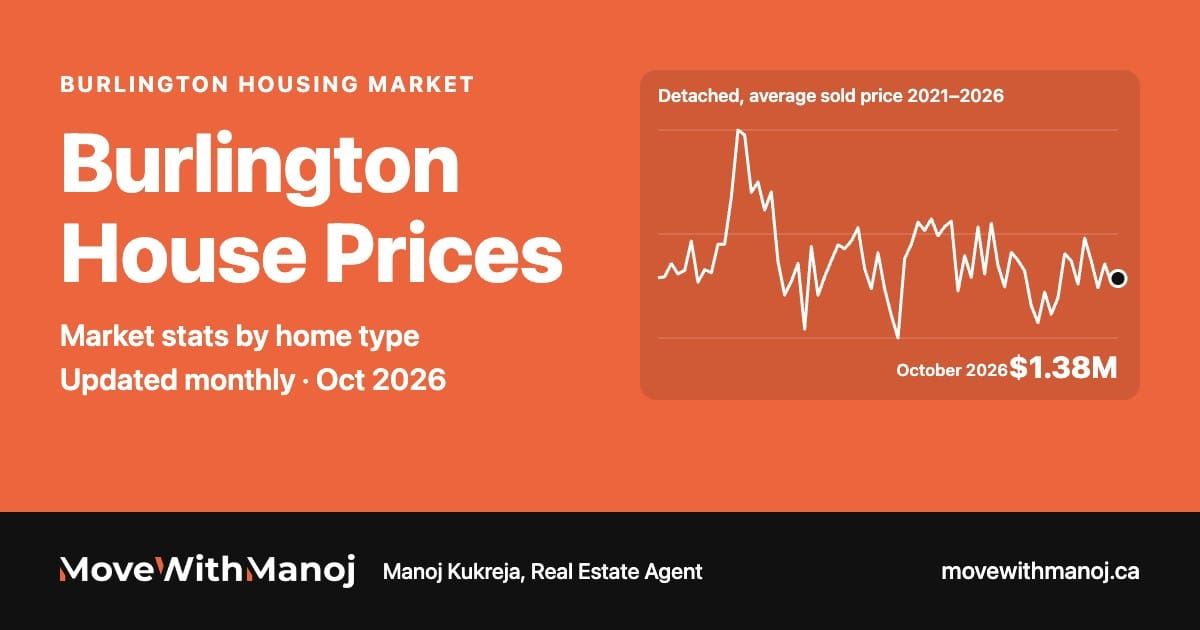
Detached houses in Burlington sold for about 11% more than a year ago. 101 sold in October, down from 103 a year earlier. They're taking about 29 days to sell, a little faster than last year. Homes are going for about 97% of the asking price, so well-priced homes still sell close to asking.
 movewithmanoj.ca
Burlington detached houses: average sold price
Every month since January 2021. Point at (or tap) the line to see any month.
Embed this chart on your website
Free to use. Copy this code into your website or blog and keep the credit link.
What detached houses sold for before
*How much higher (▲) or lower (▼) the October 2026 price is compared with then.
 See detached homes for sale in BurlingtonView listings →Own a detached house in Burlington? Find out what it's worth today.Free home evaluation based on recent Burlington sales. No pressure, no obligation.Get my free home evaluation →
Semi-detached houses in Burlington
Average sold price, October 2026
Semi-detached houses in Burlington sold for about 4% less than a year ago. 10 sold in October, up from 7 a year earlier. They're taking about 21 days to sell, a little faster than last year. Homes are going for about 98% of the asking price, so well-priced homes still sell close to asking.
movewithmanoj.caBurlington semi-detached houses: average sold price
Every month since January 2021. Point at (or tap) the line to see any month.
Embed this chart on your website
Free to use. Copy this code into your website or blog and keep the credit link.
What semi-detached houses sold for before
*How much higher (▲) or lower (▼) the October 2026 price is compared with then.
See semi-detached homes for sale in BurlingtonView listings →Own a semi-detached house in Burlington? Find out what it's worth today.Free home evaluation based on recent Burlington sales. No pressure, no obligation.Get my free home evaluation →Freehold townhouses in Burlington
Average sold price, October 2026
Freehold townhouses in Burlington sold for about 7% less than a year ago. 21 sold in October, up from 17 a year earlier. They're taking about 24 days to sell, a little faster than last year. Homes are going for about 98% of the asking price, so well-priced homes still sell close to asking.
movewithmanoj.caBurlington freehold townhouses: average sold price
Every month since January 2021. Point at (or tap) the line to see any month.
Embed this chart on your website
Free to use. Copy this code into your website or blog and keep the credit link.
What freehold townhouses sold for before
*How much higher (▲) or lower (▼) the October 2026 price is compared with then.
See freehold townhouse homes for sale in BurlingtonView listings →Own a freehold townhouse in Burlington? Find out what it's worth today.Free home evaluation based on recent Burlington sales. No pressure, no obligation.Get my free home evaluation →Condo townhouses in Burlington
Average sold price, October 2026
Condo townhouses in Burlington sold for about 2% more than a year ago. 42 sold in October, up from 38 a year earlier. They're taking about 35 days to sell. Homes are going for about 97% of the asking price, so well-priced homes still sell close to asking.
movewithmanoj.caBurlington condo townhouses: average sold price
Every month since January 2021. Point at (or tap) the line to see any month.
Embed this chart on your website
Free to use. Copy this code into your website or blog and keep the credit link.
What condo townhouses sold for before
*How much higher (▲) or lower (▼) the October 2026 price is compared with then.
See condo townhouse homes for sale in BurlingtonView listings →Own a condo townhouse in Burlington? Find out what it's worth today.Free home evaluation based on recent Burlington sales. No pressure, no obligation.Get my free home evaluation →Condo apartments in Burlington
Average sold price, October 2026
Condo prices change with the mix of units that sell each month, so the trend line tells you more than any single month. Right now a 1-bedroom condo averages $435,750 and a 2-bedroom averages $631,065.
movewithmanoj.caBurlington condo apartments: average sold price
Every month since January 2021. Point at (or tap) the line to see any month.
Embed this chart on your website
Free to use. Copy this code into your website or blog and keep the credit link.
What condo apartments sold for before
*How much higher (▲) or lower (▼) the October 2026 price is compared with then.
See condo apartment homes for sale in BurlingtonView listings →Own a condo in Burlington? Find out what it's worth today.Free home evaluation based on recent Burlington sales. No pressure, no obligation.Get my free home evaluation →Average rent in Burlington
Thinking about renting, or buying a place to rent out? Here's what Burlington condos and condo townhouses leased for, on average, from July to September 2026.
Buy or rent? In October 2026, a 1-bedroom condo in Burlington sold for about $436,000, or rents for about $2,208 a month. A 2-bedroom sold for about $631,000, or rents for about $2,696 a month.
Rents come from TRREB's quarterly rental report and are updated every three months. Looking for a place? See Burlington homes for lease.
What this means for you
If you're buying: good homes don't last long, so get pre-approved, know your must-haves and be ready to move quickly.
If you're selling: buyers are competing for a limited number of homes, so a well-prepared, well-priced home can sell quickly and for a strong price. The first step is knowing what your home is worth today.
What's your Burlington home worth?
Get a free home evaluation based on what's actually selling on your street. No pressure, no obligation.
Get my free home evaluationOr call me at 647-576-2100.
House prices in other GTA cities
See the GTA housing market overview, or pick a city.
TorontoTorontoPeelMississaugaBramptonCaledonYorkVaughanMarkhamRichmond HillNewmarketAuroraStouffvilleKing TownshipEast GwillimburyGeorginaHaltonOakvilleMiltonHalton HillsDurhamPickeringAjaxWhitbyOshawaClaringtonUxbridgeScugogBrockFrequently asked questions
What is the average house price in Burlington?
It depends on the type of home. In October 2026, the average sold price in Burlington was $1,376,964 for a detached house, $868,900 for a semi-detached house, $857,186 for a freehold townhouse, $758,690 for a condo townhouse and $658,858 for a condo apartment.
Are house prices going down in Burlington?
Compared with October 2025, detached houses were up about 11%, semi-detached houses were down about 4%, freehold townhouses were down about 7%, condo townhouses were up about 2% and condo apartments were down about 2%. The average detached price is about 25% below its peak of $1.83M in January 2022.
Is Burlington a buyer's or seller's market right now?
Seller's for detached homes, with about 3.1 months of inventory. Under 4 months favours sellers, 4 to 6 is balanced and over 6 favours buyers.
How long does it take to sell a house in Burlington?
In October 2026, it took about 29 days for a detached house, 21 days for a semi-detached house, 24 days for a freehold townhouse and 35 days for a condo townhouse.
What is the average rent in Burlington?
From July to September 2026, the average monthly rent in Burlington was $2,208 for a 1-bedroom condo, $2,696 for a 2-bedroom condo, $2,813 for a 2-bedroom condo townhouse and $3,342 for a 3-bedroom condo townhouse.
Where do these numbers come from?
Average sold prices and the number of homes sold come from the Toronto Regional Real Estate Board's monthly Market Watch report. Days to sell, homes for sale and the share of asking price come from Burlington listings on movewithmanoj.ca. This page is updated every month.
More about Burlington: read our guide to living in Burlington, or browse all Burlington homes for sale.
How we calculate these numbers
This page uses two sources, and it is updated every month once the new numbers come out.
- Average sold price and homes sold come from the Toronto Regional Real Estate Board (TRREB) Market Watch report. A home counts in the month its sale became firm, meaning the buyer and seller both signed and all conditions were removed, not the month it closed.
- Average sold price is the total value of all sales of that type of home in Burlington that month, divided by the number of homes sold. Each type of home is counted on its own, so a condo never pulls down the detached average.
- Days to sell, active homes for sale, share of the asking price and the buyer's or seller's market reading come from Burlington listings on movewithmanoj.ca for October 2026.
- Average rents come from TRREB's quarterly Rental Market Report (Q3 2026): the average monthly rent of condo apartments and condo townhouses leased through TRREB's MLS® System. TRREB doesn't report rents for detached and semi-detached houses.
Why averages jump around: an average moves when prices change, but also when a different mix of homes sells. A month with a few large luxury sales pushes the average up even if most prices didn't move. Types of home with only a handful of sales can swing a lot from month to month, so the long-term trend in each chart tells you more than any single month.
A note on older numbers: TRREB counts sales listed on its own MLS® System. Before about 2020, many Burlington homes were listed only with a local Halton board, so the 10-years-ago figures are based on fewer sales and are best used as a rough guide.